Sales Report
Category : Trackers
Salesman use this to know how they are doing in last operation.
A Sales Report Template is a document used by businesses to track, analyze, and present sales data over a specific period. Sales reports are vital for monitoring sales performance, identifying trends, and making data-driven decisions. They are typically used by sales teams, managers, and executives to assess the effectiveness of sales strategies and set future goals.
Key Components of a Sales Report Template:
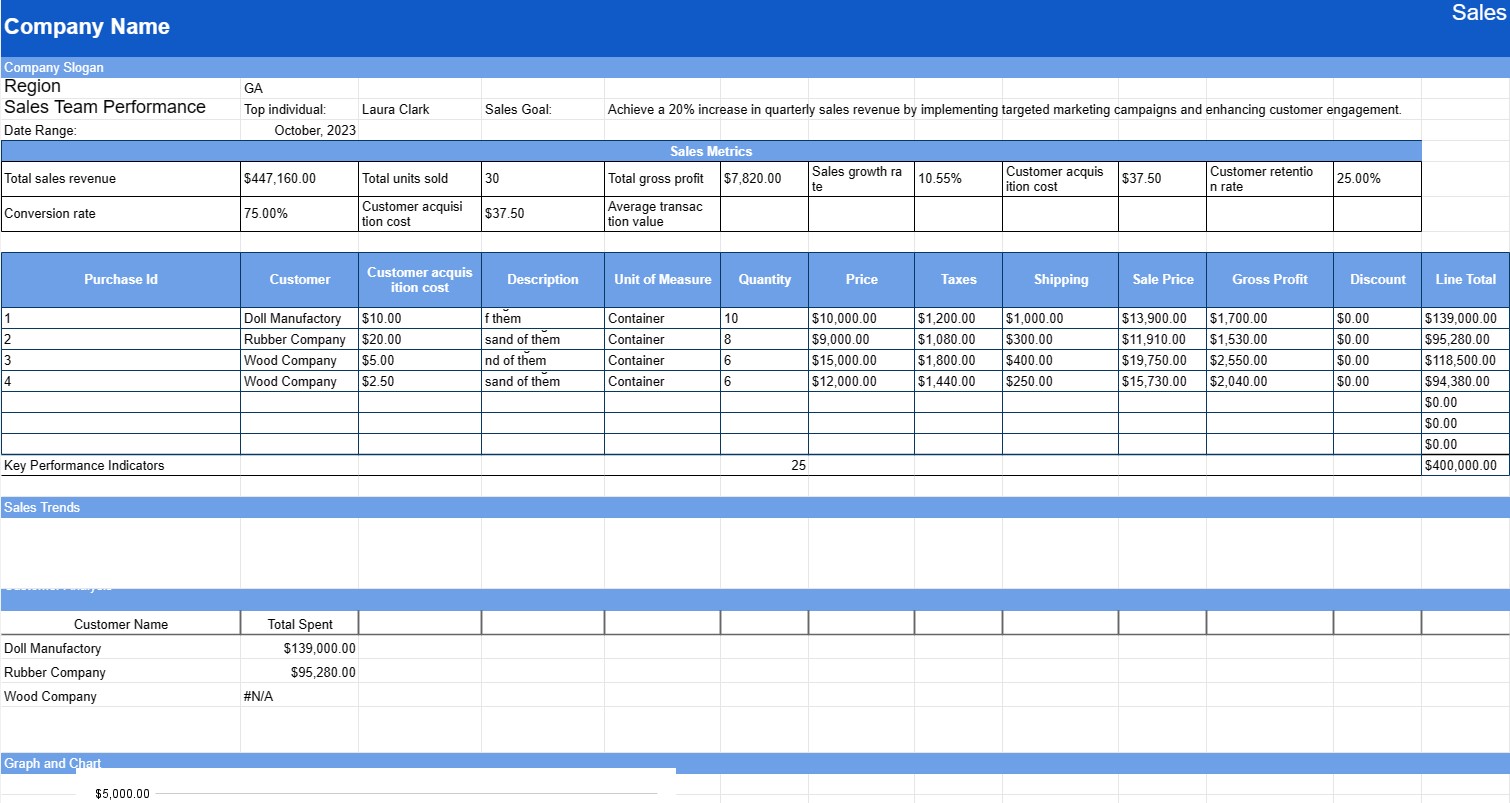
- Report Title: The title typically includes the period covered by the report (e.g., Monthly Sales Report, Quarterly Sales Analysis).
- Date Range: Specifies the date range for which the sales data is being reported (e.g., month, quarter, year).
- Summary: Provides a concise overview of the sales performance during the reporting period, including total sales revenue, number of units sold, and any significant achievements or milestones.
- Sales Metrics: Presents key sales metrics and KPIs (Key Performance Indicators) such as:
- Total sales revenue
- Total units sold
- Gross profit
- Sales growth rate
- Average transaction value
- Customer acquisition cost
- Customer retention rate
- Conversion rate
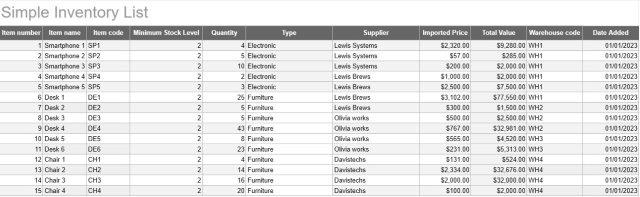
- Sales by Product/Service:Itemizes sales data for each product or service, including the quantity sold, unit price, and total revenue generated. This section may include charts or graphs for visual representation.
- Sales by Region or Territory: If applicable, the report may break down sales data by geographical region or sales territory, highlighting areas of strong and weak performance.
- Top Performing Products/Services: Lists the top-selling products or services during the reporting period, along with their respective sales figures.
- Sales Trends: Provides an analysis of sales trends, such as seasonality or changes in customer behavior, and explains how these trends have impacted sales.
- Customer Analysis: Includes data on customer demographics, purchasing behavior, and any notable changes in customer profiles.
- Challenges and Opportunities: Identifies challenges faced during the reporting period (e.g., market competition) and opportunities for improvement or growth.
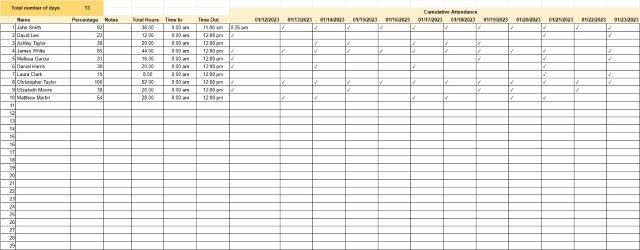
- Sales Team Performance: Assesses the performance of the sales team, highlighting individual or team achievements, goals met, and areas for improvement.
- Recommendations: Offers recommendations and action items based on the analysis, such as adjustments to sales strategies, pricing, or product offerings.
- Graphs and Charts: Utilizes visual representations like bar charts, pie charts, and line graphs to make the data more accessible and understandable.
Benefits of Using a Sales Report Template:
- Performance Assessment: Allows businesses to evaluate their sales performance against goals and targets.
- Data-Driven Decision-Making: Provides valuable insights for making informed decisions about sales strategies and resource allocation.
- Goal Setting: Helps set realistic sales goals and objectives for future periods.
- Trend Analysis: Identifies trends and patterns in sales data, enabling proactive responses to market changes.
- Communication: Facilitates communication and transparency within the organization by sharing data and insights with stakeholders.
- Motivation: Recognizes and motivates sales teams through the acknowledgment of achievements.
- Benchmarking: Enables comparisons between different time periods, products, or regions for benchmarking purposes.
In conclusion, a Sales Report Template is an essential tool for businesses to track and assess their sales performance comprehensively. It provides a structured format for presenting sales data, trends, and recommendations, empowering organizations to make data-driven decisions and optimize their sales strategies.
Easy Preview and Download Spreadsheet Template
View the full version of a spreadsheet template with no limitations to see if you like it then you can download the excel template to store it on your device and use it for free.
Access Spreadsheet Template from Anywhere
This is working on all popular operating system such as Windows, MacOS, Linux, iOS. You can see the spreadsheet templates and download them without additional programs.
How to use a template
Figure out how to preview, download and then use the spreadsheet template by following the steps which are extremely easy to follow
More similar templates
See more of the spreadsheet templates which are under the same category with the chosen one.