
サービス価格表
カテゴリー : トラッカー
顧客に価格を記載したサービスを提供し、仕事を依頼した場合にいくら支払うかを知らせます。
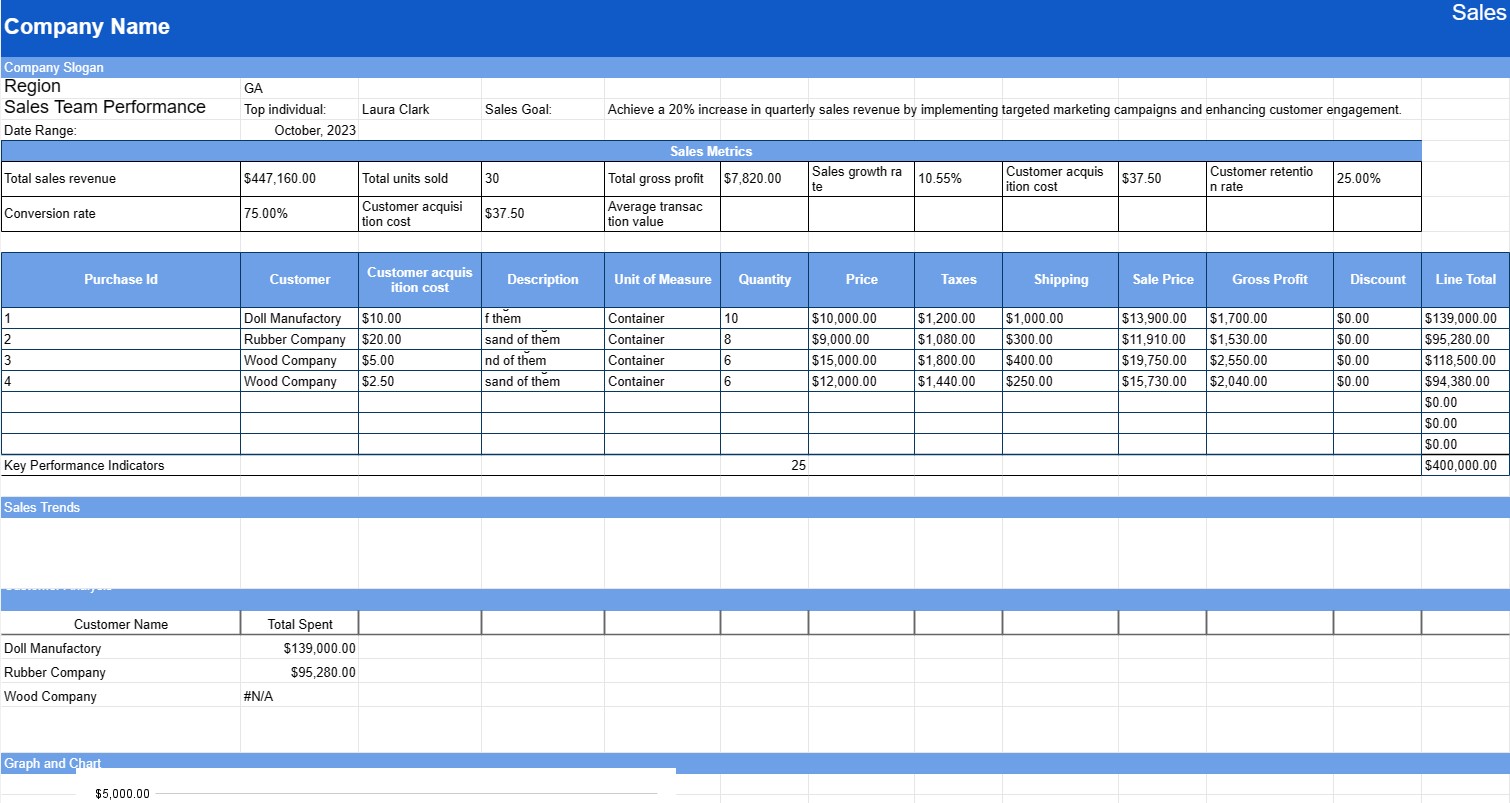
売上レポート テンプレートは、企業が特定の期間の売上データを追跡、分析、表示するために使用するドキュメントです。販売レポートは、販売実績の監視、傾向の特定、データに基づいた意思決定を行うために不可欠です。通常、営業チーム、マネージャー、経営幹部が営業戦略の有効性を評価し、将来の目標を設定するために使用します。
営業レポート テンプレートの主なコンポーネント:
- < scan>レポート タイトル: 通常、タイトルにはレポートの対象期間が含まれます (月次売上レポート、四半期売上分析など)。
- 日付範囲:販売データがレポートされる日付範囲 (月、四半期、年など)。
- 概要: レポート期間中の販売実績の簡潔な概要を提供します。総売上収益、販売ユニット数、重要な成果やマイルストーン。
- 売上指標: 以下のような主要な売上指標と KPI (主要業績評価指標) を示します。
- 総売上収益
- 総販売個数
- 売上総利益
- 売上成長率
- 平均取引額
- 顧客獲得コスト
- 顧客維持率
- コンバージョン率
- 製品別売上/サービス: 販売数量、単価、生成された総収益など、各製品またはサービスの販売データを項目別に表示します。このセクションには、視覚的に表現するためのチャートやグラフが含まれる場合があります。
- 地域または地域別の売上高: 該当する場合、レポートでは売上データを地理的地域または販売地域別に分類し、エリアを強調表示することがあります。
- トップパフォーマンスの製品/サービス: レポート期間中に最も売れた製品またはサービスと、それぞれの売上高をリストします。
- 販売傾向: 季節性や顧客行動の変化などの販売傾向の分析を提供し、これらの傾向が販売にどのような影響を与えたかについて説明します。
- 顧客分析: 顧客層、購買行動、顧客プロファイルの顕著な変化に関するデータが含まれます。
- 課題と機会: レポート期間中に直面した課題を特定します(例:
- 営業チームのパフォーマンス: 営業チームのパフォーマンスを評価し、個人またはチームの成果、達成した目標、改善の領域を強調します。
- 推奨事項: 販売戦略、価格設定、製品提供の調整など、分析に基づいて推奨事項とアクション アイテムを提供します。
- グラフおよびグラフ: 棒グラフ、円グラフ、折れ線グラフなどの視覚的表現を利用して、データをよりアクセスしやすく理解しやすくします。
販売レポート テンプレートを使用する利点:
- パフォーマンス評価: 企業が目標や目標に照らして販売実績を評価できるようにします。
- データ主導の意思決定: 販売戦略とリソースの割り当てについて情報に基づいた意思決定を行うための貴重な洞察を提供します。
- 目標設定: 将来の期間の現実的な販売目標と目標を設定するのに役立ちます。
- トレンド分析: 販売データの傾向とパターンを特定し、市場の変化に積極的に対応できるようにします。
- コミュニケーション: 情報を共有することで、組織内のコミュニケーションと透明性を促進します。
- モチベーション: 成果を認めることで営業チームを評価し、モチベーションを高めます。
- ベンチマーク:
結論として、販売レポート テンプレートは、企業が販売実績を包括的に追跡および評価するために不可欠なツールです。販売データ、傾向、推奨事項を提示するための構造化された形式を提供し、組織がデータに基づいた意思決定を行い、販売戦略を最適化できるようにします。
スプレッドシートのテンプレートを簡単にプレビューしてダウンロード
制限なしでスプレッドシート テンプレートのフル バージョンを表示して気に入るかどうかを確認し、Excel テンプレートをダウンロードしてデバイスに保存し、無料で使用できます。
どこからでもスプレッドシート テンプレートにアクセス
これは、Windows、MacOS、Linux、iOS などのすべての一般的なオペレーティング システムで動作します。スプレッドシート テンプレートを表示し、追加のプログラムを必要とせずにダウンロードできます。
テンプレートの使用方法
非常に簡単な手順に従って、スプレッドシート テンプレートをプレビュー、ダウンロード、使用する方法を理解します。
1
請求書、予算、カレンダー、その他のプランナー、その他のトラッカーなどのカテゴリを選択し、スプレッドシート テンプレートをクリックしてオンラインで表示します
2
スプレッドシート テンプレートをプレビューした後、目的に合っていると思われるものをダウンロードできます
3
1 回デバイス上にファイルがある場合は、そのファイルにデータを入力するか、ユースケースに合わせて変更するだけです
4
スプレッドシート テンプレートの作成が完了したら、選択した方法で使用できます
さらに類似したテンプレート
選択したものと同じカテゴリにあるスプレッドシート テンプレートをさらに表示します。


